Every product analytics article on the internet will exclaim the importance of thorough and complete analytics tracking. What few acknowledge is the sheer time and effort involved in implementing a robust tracking plan. At Bottle Rocket, we understand that setting up or improving your analytics can seem like a daunting task. That’s why we’ve created this guide to help you get started on your analytics journey using the Minimum Viable Product (MVP) mindset.
THE ROLES
Before diving into the process, it’s important to define the roles within the analytics process. Depending on the size and structure of your organization, these roles may be filled by different individuals or teams:
- Stakeholder(s): This is your champion, a senior leader who can justify the resources needed for the project. They are passionate about creating a data-informed culture built on accuracy and accountability.
- Product Manager / Marketing Manager: This role translates your product’s business goals into the metrics that matter. They also coordinate all roles to move towards implementation.
- Analyst: This role builds the tracking plan, defines events and properties, and generates insights from the platform. This role can also QA events before product launch.
- Engineering: This role understands the technical structure of your product and can implement events.
PHASE 1 (1-2 WEEKS)
The first step in the process is a group gathering to create and align on analytics goals. The agenda for this meeting might look something like this:
- Discovery Workshop (3 hours)
- Project Charter
- Goals and objectives of analytics project
- Roles involved (product, analyst, engineering.)
- Timeline
- Review Current Analytics Structure
- Document what exists now
- What’s working, what needs improvement?
- Business Goals and Strategy
- High level, 2025 plan
- High level, 2025 plan
- Understand User Needs and Behaviors
- Document the Top 5 actions on your site/app
- Document the Top 5 actions on your site/app
- Document Use Cases for Analytics
- Ex. How well is our onboarding experience converting guest users into paid subscribers?
- Prioritize the use cases from most to least valuable.
- Ex. How well is our onboarding experience converting guest users into paid subscribers?
2. Plan Analytics Goals and Strategy
- Identify Key Metric
- The focus metric is the most important signifier of success. This can be a simple metric like annual recurring revenue (ARR) or a combination of metrics like “digital transactions per active user”
- The focus metric is the most important signifier of success. This can be a simple metric like annual recurring revenue (ARR) or a combination of metrics like “digital transactions per active user”
- Define Other Metrics that Matter
- Identify 2-4 metrics in each of the main stages of the customer journey. For example:
- Acquisition
- New registered users
- New users
- Registration rate
- Conversion
- Conversion rate (new users who placed orders / new users)
- First order count
- Engagement
- Weekly active users (timeframes can vary depending on business, daily, weekly, monthly, etc.)
- Number of registered users browsing
- Number of users adding products to cart
- Retention
- Returning users (time frame depends on how often customers need to use your product)
- Churn rate (rate at which customers stop making purchases within a given timeframe)
- Acquisition
- Identify 2-4 metrics in each of the main stages of the customer journey. For example:
- Create Event Tracking Plan
- Define top events and properties that match the Top 5 actions
- Define user properties
- SHORTCUT – use Gemini and BR’s tracking plan template to get a head start on your tracking plan.
- Prioritize Events for MVP
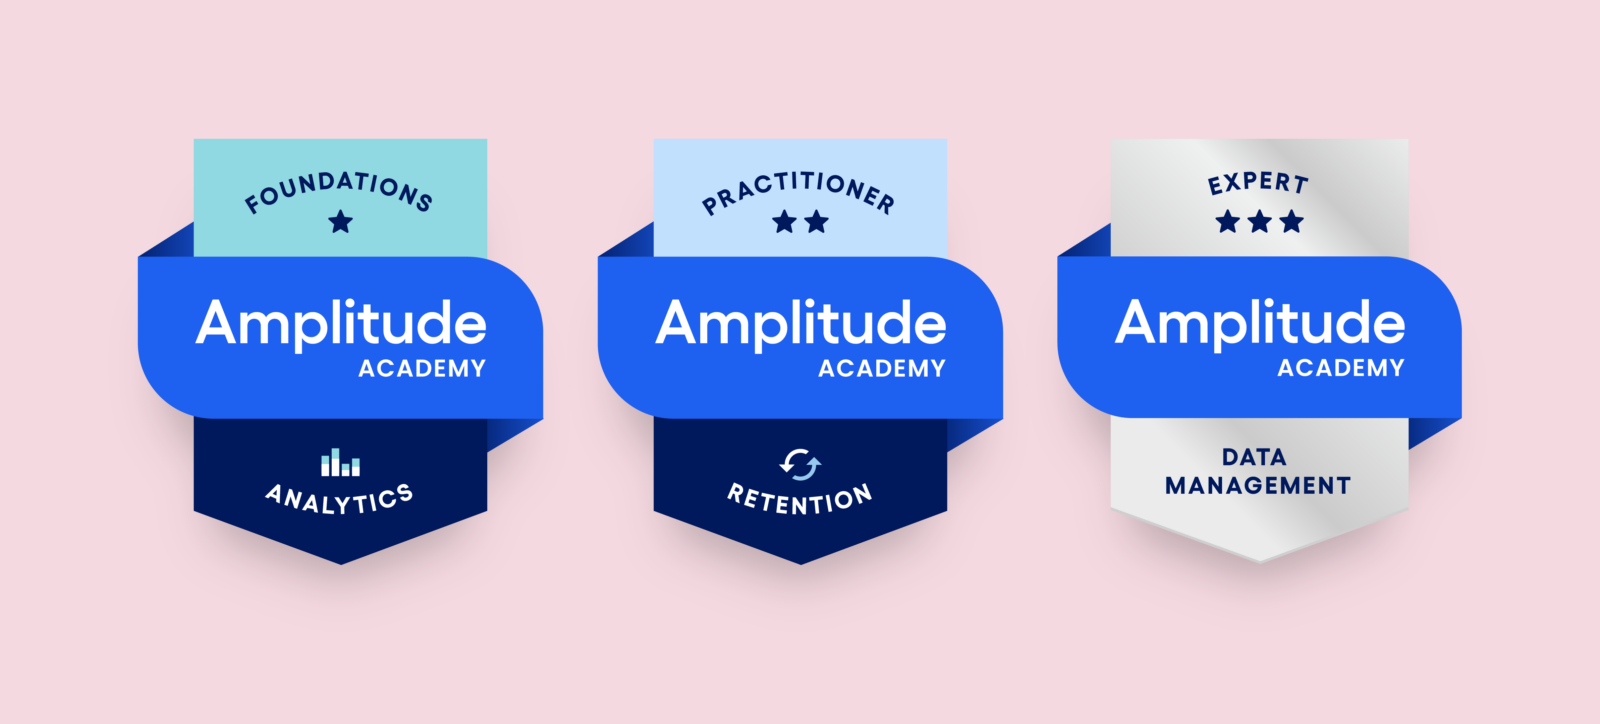
Extra Credit
- Complete Amplitude Academy analytics foundation certification
PHASE 2 (3-X WEEKS)
Timing during this phase can vary depending on development team capacity.
- Configure analytics and data stack
- Setup analytics platform
- Popular options include Mixpanel, Firebase, or Amplitude (recommended)
- Load SDKs on mobile app or web platform
- Ensure data is flowing correctly
- Setup dev and prod environments
2. Implement and QA events across platforms
- Write analytics user stories based on the tracking plan completed during phase 1.
- SHORTCUT – use this user story template to write user stories developers love.
- QA events with Amplitude’s event stream tool.
3. Create initial reports and dashboards
- Start with primary and secondary metrics for dashboard building. The core user journey’s should inform the dashboard structure.
- Use Amplitude’s AI tool to quickly generate charts for dashboards.
Extra Credit
- Learn how analysts can use Amplitude’s Data platform to create events themselves.
PHASE 3 (1-2 WEEKS)
- Develop analytics capabilities roadmap
- Share new data tracking capabilities internally
- Plan for future updates and data governance
After Phase 3, keep taking an agile approach towards product analytics. Your configuration will never be fully complete, however you should receive constant value from the platform. We hope this guide can be the catalyst within your organization that grows your analytics capabilities.
ADVANCED SUPPORT
At Bottle Rocket, we are committed to helping businesses leverage the power of data to create better digital products. Whether you’re just getting started with analytics or looking to improve your existing setup, our team is here to guide you every step of the way.